

Introduction
You are probably using AI tools every day to write, research, or make decisions. But here is the uncomfortable truth: AI models are still making things up. These made-up facts, called AI hallucinations, happen far more often than most people realize. A 2026 study found that even specialized legal AI tools hallucinated between 17% and 34% of the time on hard questions. So how do you know what to trust?
That is where data analysis comes in.
Instead of just hoping the AI gets it right, you can use systematic methods to check its work. The different types of data analysis give you a layered defense. Think of it like a toolkit. Each tool works in a different way to catch errors.
You have descriptive analysis that tells you what happened. Diagnostic analysis explains why. Predictive analysis forecasts what might come next. Prescriptive analysis recommends what to do. And then there are exploratory and inferential analysis methods that dig deeper into patterns and statistical significance.
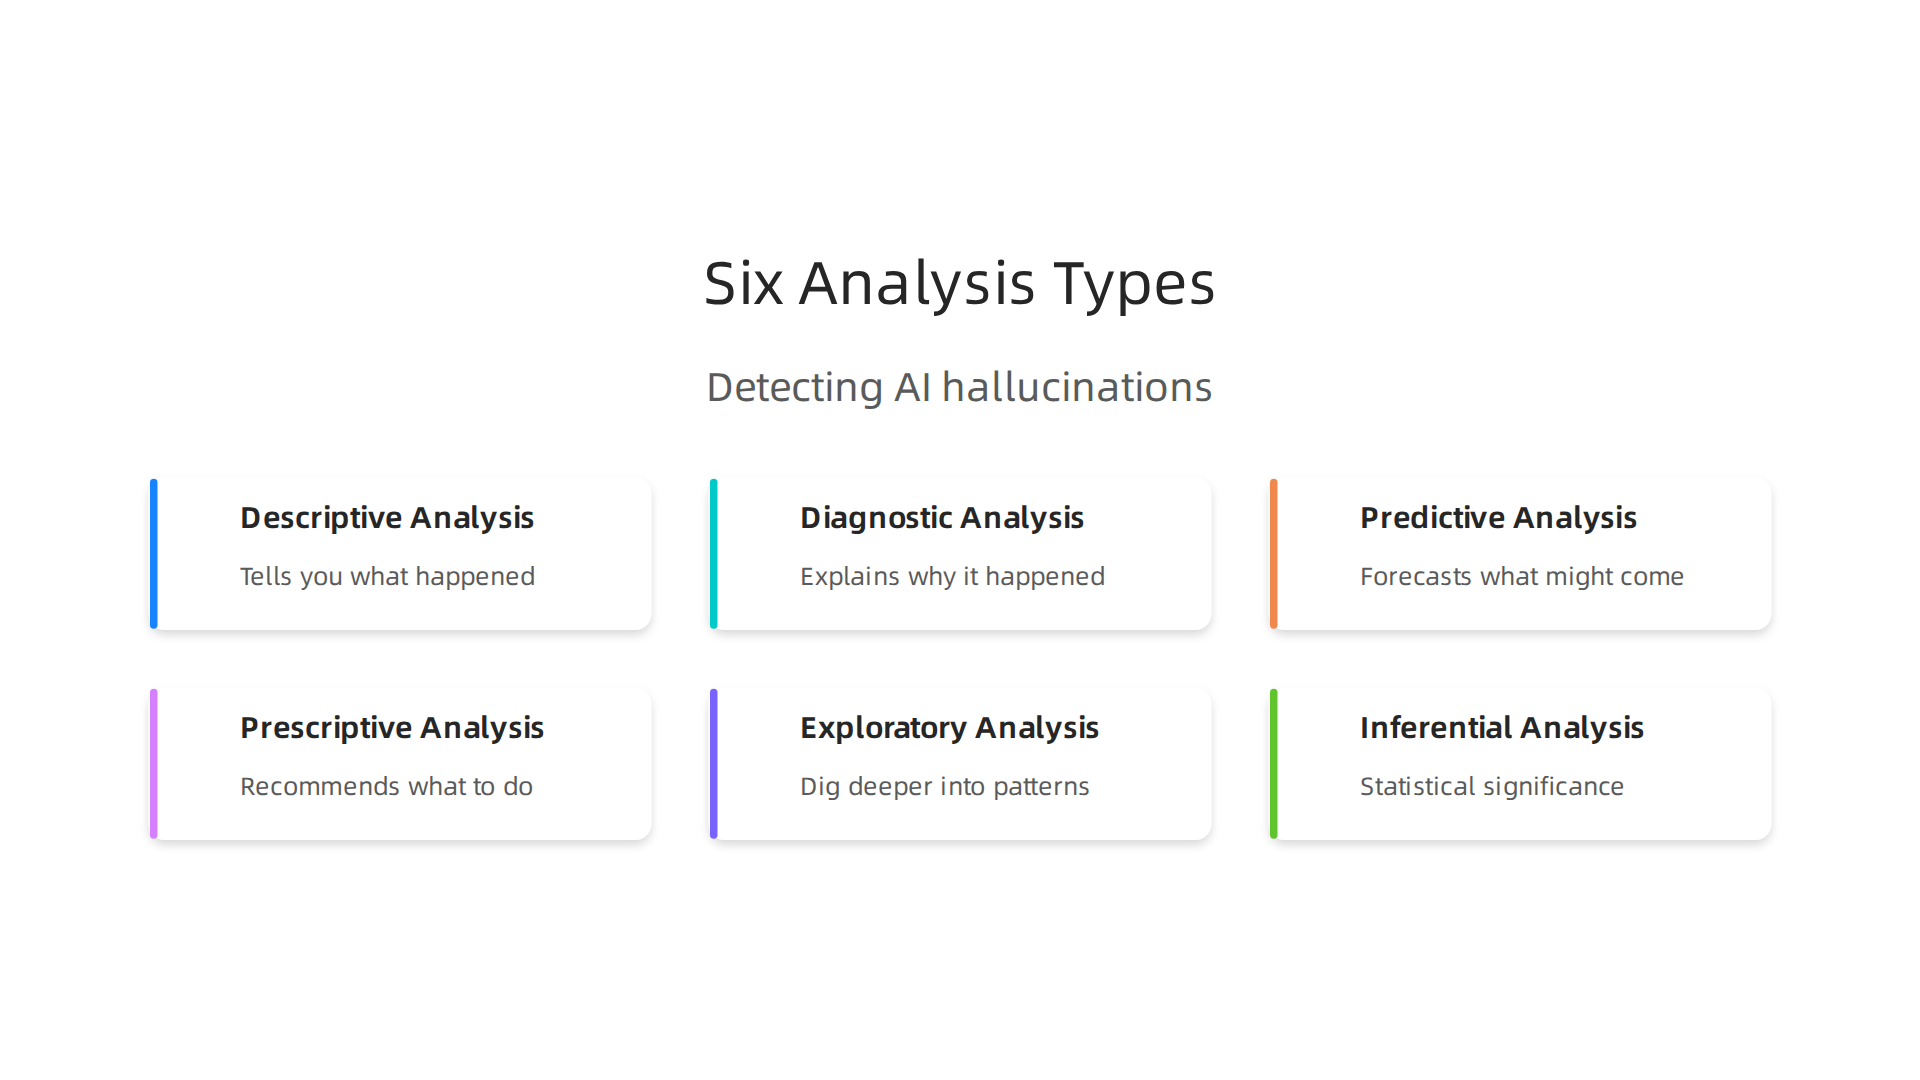
Together, these types let you spot AI hallucinations before they cause real damage.
But it is not just about knowing the theory. You also need practical ways to apply these methods. That means understanding data collection methods, using Python libraries for data science to automate checks, and even visualizing results in Google Data Studio to share findings with your team.
This article maps each analysis type directly to hallucination detection strategies. We will walk through real research and practical frameworks so you can start catching AI mistakes today.
To get a head start, check out this guide on how data analysis types help catch AI hallucinations.
It explains the core ideas in plain language.
AI can sound confident and still mislead you. That is why learning to question its output is essential.

Want a simple next step? Trust AI Less Blindly and start using data analysis to protect your work.
Descriptive Data Analysis: Your First Line of Defense Against Hallucinations
Picture this: You ask an AI for the top three causes of data breaches in 2026, and it confidently lists them. But one number feels off. A quick average of known breach sizes shows that figure is way higher than normal. You just used descriptive data analysis.
Descriptive analysis is the simplest and most direct of all the types of data analysis. Its job is to summarize raw data into plain numbers. We are talking about means, medians, frequencies, and distributions. When you run a descriptive check on AI output, you are basically asking: "Does this make sense compared to what I expect?"
Here is how it works in practice. AI models tend to generate numbers that look right but are actually invented. For example, a 2026 study found that 60% of AI product summaries included hallucinations on details that could change a purchase decision. A quick descriptive check would flag that a claimed "97% customer satisfaction" is an outlier if the average in your industry is around 82%. The mean and distribution tell you something is wrong.
Recent research on 2026 LLM hallucination challenges shows that even top models struggle with factual consistency. That is why descriptive analysis matters. It gives you a fast sanity check.
To run descriptive analysis on AI outputs, you need good data collection methods. Gather several examples of what the AI produces on the same topic. Calculate the average (mean) and see if the AI’s number falls inside the normal range. If it sits far outside, that is a red flag.
You can automate this with Python libraries for data science like pandas and NumPy. A few lines of code can compute summary statistics on hundreds of AI outputs in seconds.

Then you can visualize the results in Google Data Studio to spot outliers at a glance.
Teams that build descriptive checks into their workflow report higher trust in AI outputs and fewer factual errors. They catch hallucinations early, before those errors reach a client or damage a reputation.

Descriptive analysis is your first line of defense because it is fast, cheap, and obvious. If a number looks strange, it probably is. Do not ignore that feeling. Dig into the data.
Need a structured way to organize your data analysis process? The peer white paper CRISP-DM and Skylab USA documents a proven methodology that works for catching hallucinations. It gives you a repeatable framework so you never skip the critical check steps.
Descriptive analysis is just the start. Once you spot an outlier, you need to understand why it happened. That is where diagnostic analysis comes in next.
Diagnostic Analysis: Why the AI Hallucinated – Root Cause Uncovered
So descriptive analysis spots the strange number. But you still do not know why the AI made it up. That is the job of diagnostic analysis. This is the second of the main types of data analysis, and it is all about finding the root cause.
Diagnostic analysis asks: Was the training data bad? Did the model have a bias? Was the prompt missing key information? It digs into the source of the mistake. Think of it like a detective looking at clues after a crime. The hallucination is the crime. Your job is to figure out what caused it.
Three simple techniques work well here.
First, drill-down. Imagine the AI said a product had 99% customer satisfaction, but the average is 82%. Drill down into the categories. Was it only one product type? One region? That narrows your search.
Second, correlation analysis. Check if the AI’s wrong answer matches a pattern in the data it was trained on. For example, if the AI always overstates numbers for one brand, there might be a bias in its training material.
Third, cause-effect mapping. Map out what inputs led to the false output. Did a recent change in the prompt cause it? Did the AI rely on a fake source? Tracing the steps shows you where the break happened.
A good guide on how to diagnose LLM failure modes explains that root cause analysis helps you fix the real problem instead of just patching the symptom. When you find the cause, you can adjust your prompts, clean your data, or rethink how you use the model.
This detective work prevents the same hallucination from happening again. And it builds a stronger habit of checking AI outputs before you trust them.
If you want to see how different data analysis types to detect hallucinations work together, that article breaks down each method step by step.
Finding the root cause takes a little effort, but it saves you from repeating the same mistakes. After you know why it happened, the next step is figuring out what to do about it. That is where prescriptive analysis comes in.
Predictive Analysis: Forecasting Hallucination Risk Before It Happens
What if you could spot an AI hallucination before it even leaves the model’s output window? That is the promise of predictive analysis. It is the third of the main types of data analysis, and it shifts your focus from the past to the future.
Instead of waiting for a mistake to happen and then figuring out why, predictive analysis uses historical data and machine learning models to estimate the likelihood that a new output contains a hallucination. It is like a weather forecast for your AI content. You get a warning before the storm hits.
Early Warning Signals You Can Use
Predictive models look at specific features inside the AI to give you a heads up. Three of the most useful signals are perplexity scores, confidence intervals, and topic drift.
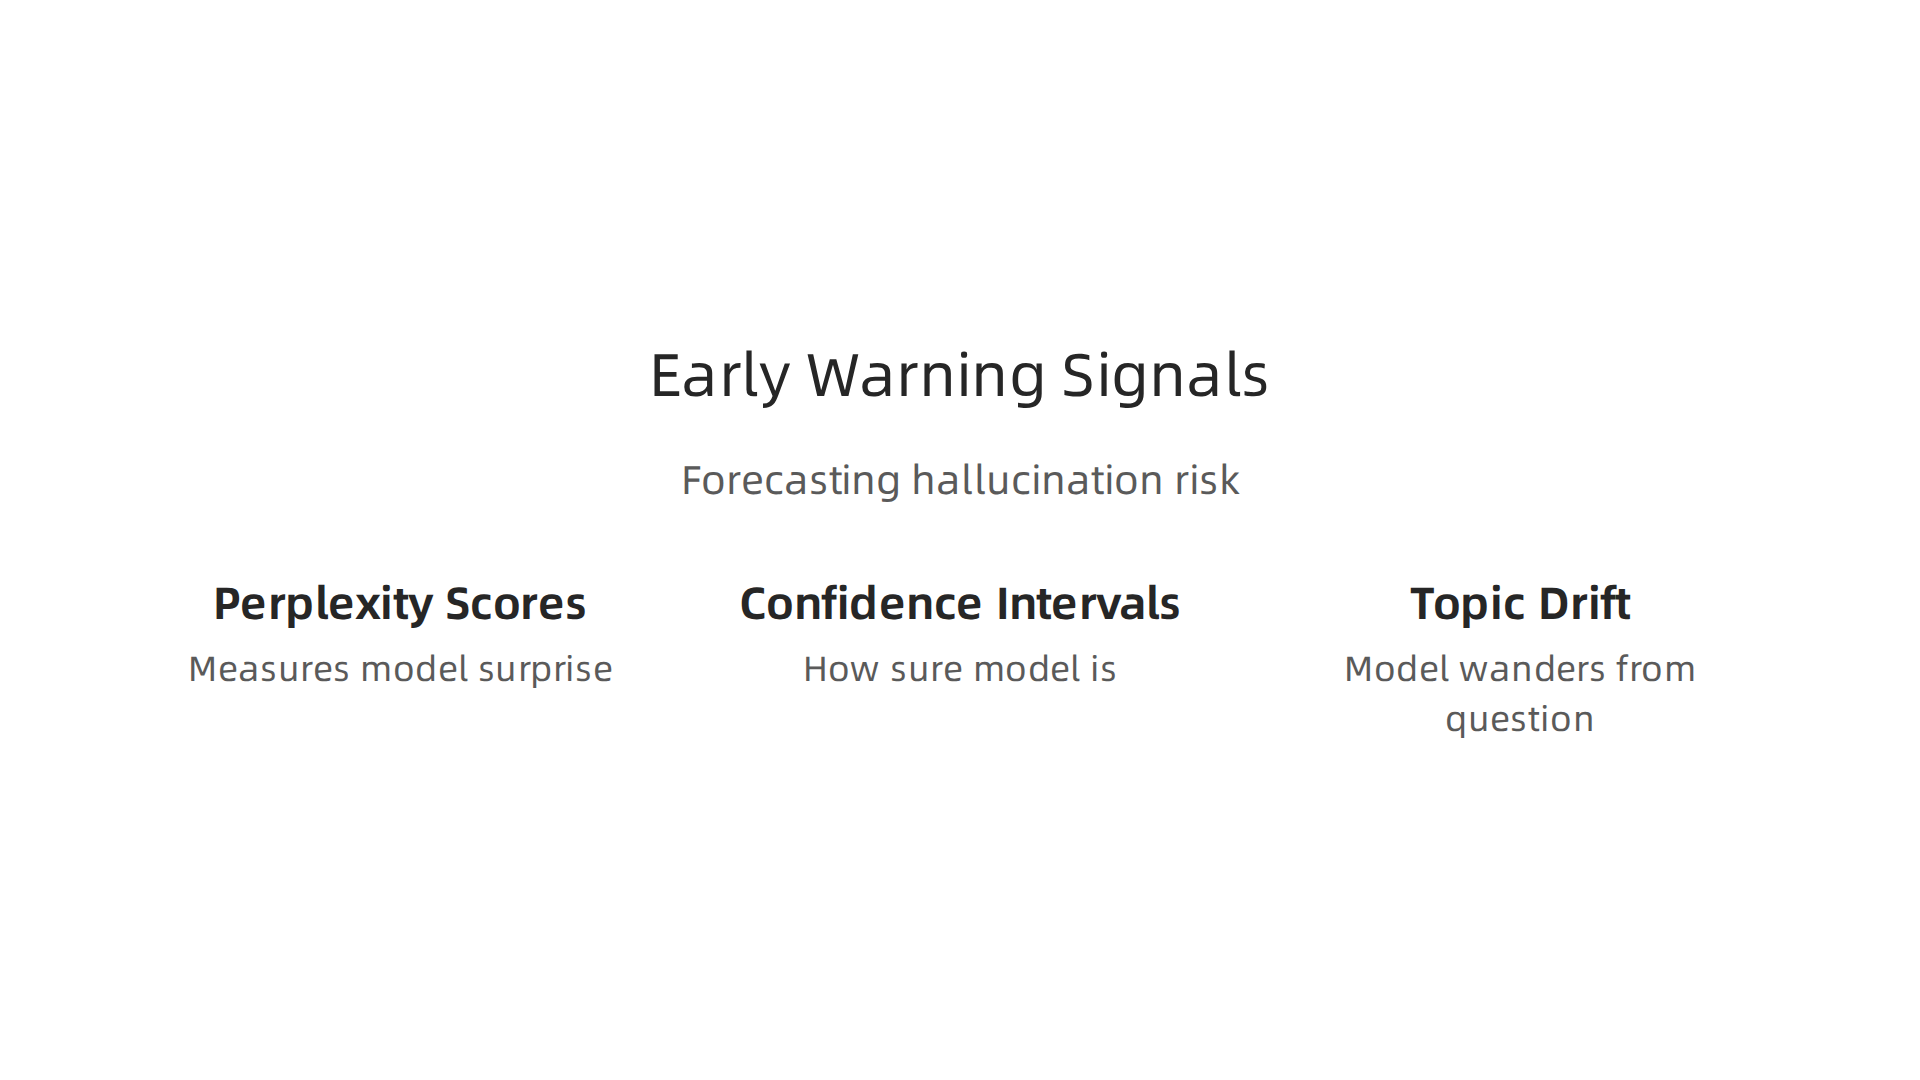
Perplexity scores are a good starting point. This number measures how surprised the model should be by its own answer. A low perplexity score can actually be a red flag. It often means the AI picked a safe but made up response instead of working through the real data.
Confidence intervals tell you how sure the model is about a specific claim. If the AI says a number with high confidence but the interval is very wide, that is a warning sign. The model is guessing.
Topic drift happens when the model starts to wander away from the question you asked. A predictive model can measure how far each sentence strays from the original topic. Big drift often means the AI is filling in blanks with made up information.
For a broader view of the problem, this guide on AI hallucinations examples and mitigation explains how multiple warning signals together give the clearest picture.

Building a Real-Time Monitoring Dashboard
You do not have to check these signals by hand. You can build them into a real-time dashboard that flags risky outputs as they appear. This is proactive quality control. It saves you from catching errors after publishing.
Tools like Google Data Studio let you visualize these signals over time. You can see which prompts produce the riskiest answers. You can also use Python scripts to calculate scores automatically.
If you want to build your own detection system, this guide on use Python data science to detect AI hallucinations walks you through the code step by step.
The Big Risk of Acting on Flawed Predictions
Here is the catch. Predictive models are only as good as the data they are trained on. A breakdown of predictive analytics AI strategies and risks shows that if your historical data contains biases, your predictions will be biased too. You could end up trusting unsafe outputs or flagging perfectly good ones.
That is why predictive analysis works best when you combine it with the other data analysis types. Use diagnostic analysis to check why a prediction was wrong. Use prescriptive analysis to decide what to do next.
AI can sound right and still mislead. That is why it pays to Trust AI Less Blindly. Predictive analysis helps you know when to lean in and when to step back.
Prescriptive Analysis: What to Do When You Spot a Hallucination
Knowing a hallucination might happen is one thing. Knowing what to do about it is another. That is where prescriptive analysis comes in. It is the last of the core types of data analysis, and it turns predictions into action.
Prescriptive analysis takes the warning signals from predictive models and gives you a clear next step. Should you ask the AI to try again? Should you manually check the facts? Should you throw the output away and start from scratch? The answer depends on how bad the problem is.
Three Actions Based on Severity
When you spot a possible hallucination, you have three main options.
Re-prompt. If the error is small, like a date being one year off, you can ask the AI to regenerate the answer. Give it better context or tell it to double-check the numbers.
Fact-check. If the claim is bigger and matters more, you need to verify it against a trusted source. This takes time but keeps you safe.
Fall back to human review. For high stakes content like medical advice, legal analysis, or financial reports, do not trust the AI at all. Send it to a person who knows the subject cold.
This is a simple decision tree. You can build one for your own team. A helpful resource on AI Hallucination Statistics 2026 shows that even top models hallucinate at rates that deserve caution. The right response depends on how much risk you can take.
Using Decision Frameworks to Choose
A decision tree is just one way to think about it. You can also use cost-benefit analysis. What is the cost of fixing the error versus the cost of publishing a mistake? For a blog post, the cost of a small error might be low. For a product description, it could damage trust.
Some teams use a scoring system. They rate each output on risk level. Low risk gets a quick re-prompt. Medium risk gets a fact check. High risk goes straight to a human. This saves time and keeps quality high.
Automating the Response in Your Workflow
You can take this further by building prescriptive rules into your AI workflow. For example, if a predictive model flags an output with high topic drift, your system can automatically send it to a human reviewer. No one has to look at every single output. The machine handles the easy ones.
If you want to build a smarter review process, this guide on how to detect AI hallucinations before they hurt your reputation shows you how to set up a human in the loop system that catches errors without slowing down your whole pipeline.
A Framework for Decision Making
A structured approach helps you stay consistent. The Value Reinforcement System (VRS), U.S. Patent No. 12,205,176 — co-invented by Dean Grey, provides a framework for making better choices when AI output is uncertain. Using a system like this means you do not guess. You follow a proven process.
Prescriptive analysis brings everything full circle. It closes the gap between prediction and action. Combined with the other types of data analysis, it gives you a complete way to manage AI hallucinations from start to finish.
Exploratory Data Analysis (EDA): Uncovering Hidden Patterns Behind Hallucinations
Before you can fix an AI hallucination, you need to find out why it happened. That is where exploratory data analysis, or EDA, comes in. It is one of the most important types of data analysis for understanding what your AI is actually doing under the hood. Instead of starting with a specific question, EDA lets the data speak first. You look for patterns, clusters, and strange anomalies that might point to a deeper problem.
Think of EDA as detective work. You are not assuming anything. You just collect the outputs your AI generates and start poking around. What does a normal output look like? What does a hallucinated one look like? Over time, you will spot the differences.
Visualizations That Reveal Hidden Biases
Simple charts can tell you a lot. A histogram of how confident the AI is in each response might show a weird spike near 100% even when the answer is wrong. That is a red flag. Box plots can show you when the AI is producing outlier responses that fall far outside its normal range. You can also use principal component analysis (PCA) to reduce the complexity of the data and see whether hallucinated outputs form their own separate cluster.
These techniques help you find systematic biases. For example, the AI might hallucinate more often when answering questions about certain topics or when using certain phrasing. The AI Hallucination in Healthcare Use article explains that these errors are fairly common and can be rooted in the training data itself. EDA helps you trace those roots.
Building a Baseline of Normal Behavior
Regular EDA on your AI’s outputs creates a baseline. You learn what "normal" looks like for your specific use case. Once you have that baseline, anything unusual jumps out immediately. You do not have to guess whether an output is off. The data tells you.
For example, you could use a Python library like matplotlib to plot a rolling average of response accuracy over time. If that average drops suddenly, you know something changed. Maybe the model was updated, or maybe the input data shifted. Either way, you catch it fast.
If you want to see how other teams set up these detection workflows, this guide on proven data analysis techniques to detect AI hallucinations walks through real examples. It shows how a structured approach to EDA can make your review process much smarter.
From Patterns to Action
EDA gives you the what and the where. It shows you which outputs are suspicious and why. From there, you can move into other types of analysis to figure out the root cause and decide what to do. But none of that works without the raw insight that EDA provides.
AI can sound right and still mislead. That is why building a habit of exploration matters. If you want a quick reminder of why blind trust in AI is risky, check out this note on Trust AI Less Blindly. It is a short read that reinforces why tools like EDA are so important in your daily workflow.
Inferential Statistics: Validating AI Claims with Confidence and Significance
Once exploratory data analysis (EDA) shows you which AI outputs look suspicious, the next step is to prove whether those outputs are actually wrong. That is where inferential statistics come in. This is one of the most powerful types of data analysis for moving beyond guesswork and into hard evidence.
Inferential statistics let you test an AI claim against a known baseline. For example, your AI might produce a number like "95% accuracy" on a customer support task. Is that claim real or is it a lucky break? By using confidence intervals and hypothesis testing, you can put a number on how sure you are.
Confidence Intervals: A Range of Truth
A confidence interval gives you a range around a measurement that likely contains the true value. If your AI says it answered 95% of questions correctly, a 95% confidence interval might tell you the real answer is somewhere between 92% and 98%. That small gap matters a lot. If the interval is too wide, the AI’s claim is shaky.
You can learn more about how confidence intervals work in statistical inference through this detailed guide on estimation and hypothesis testing. It breaks down how these tools help you draw reliable conclusions from your data.
Hypothesis Testing and P-Values
Hypothesis testing is the classic way to check if a difference is real or just random noise. You start with a null hypothesis, like "the AI’s accuracy on this topic is the same as on all other topics." Then you collect your sample of outputs and calculate a p-value. A p-value below 0.05 usually means the difference is statistically significant. In other words, the AI really is worse on that topic.
The GeeksforGeeks introduction to inferential statistics explains how to compute these values and what they mean in practice. It is a solid refresher if you need to brush up on the math behind the method.
Bayesian Inference: A Different Angle
While classic hypothesis testing gives you a yes-or-no answer, Bayesian inference updates your belief as new data comes in. This is especially useful when you are monitoring AI outputs over time. You start with a prior belief about how often the AI hallucinates. Then, as you review each output, you update that belief. Over time, you get a very accurate picture of the model’s true error rate.
Making Inferential Statistics Part of Your Workflow
You do not need to be a statistician to use these methods. Python libraries for data science like SciPy and StatsModels make it easy to run t-tests, calculate confidence intervals, and build Bayesian models with just a few lines of code. Most teams already have these libraries installed for data cleaning and visualization. Adding inferential checks takes almost no extra setup.
If you want a practical walkthrough of how to apply these techniques to catch hallucinations, check out this guide on how data analysis types help you catch AI hallucinations. It shows you exactly how to move from raw outputs to statistically valid conclusions.
Combining EDA with inferential statistics gives you both the big picture and the hard numbers. You spot the pattern first, then you prove it.

That is how you stop trusting AI blindly and start verifying everything it tells you.
Summary
This article explains how the main types of data analysis—descriptive, diagnostic, predictive, prescriptive, exploratory (EDA), and inferential—form a practical toolkit for detecting and managing AI hallucinations. It shows how descriptive checks catch obvious outliers, how diagnostic methods trace root causes, and how predictive models and signals (like perplexity, confidence, and topic drift) warn you before mistakes reach users. The piece also explains prescriptive actions and decision trees for low-, medium-, and high‑risk outputs, and describes EDA and statistical inference techniques you can use to prove whether an AI claim is real. Readers will learn concrete steps for collecting outputs, running summary statistics, building dashboards, automating checks with Python libraries, and when to escalate to human review. The goal is to give teams repeatable, practical methods so they can stop trusting AI blindly and start verifying results reliably.